Seminar on multivariate data analysis of secondary ion mass spectrometry given by Dr Gustavo F Trindade as part of the “SIMS workshop” series organised at the University of Nottingham
Multivariate analysis of mass spectrometry imaging data | contact@mvatools.com
Seminar on multivariate data analysis of secondary ion mass spectrometry given by Dr Gustavo F Trindade as part of the “SIMS workshop” series organised at the University of Nottingham
Presented by Dr Gustavo F Trindade as part of the “SIMS Workshops” series organised at the University of Nottingham
Presented by Dr Gustavo F Trindade as part of the “SIMS workshops” series organised at the University of Nottingham.

Presented by Dr Gustavo F Trindade as part of the “SIMS Workshop” series organised at the University of Nottingham
")

")
Dear user
A new test version of simsMVA has been released with several updates (download here):


It is now possible to convert a 3D dataset into 2D (imaging) or 1D (depth profiling) data. The converted dataset will be loaded on a new tab, maintaining its “hyperspectral” aspect. This is an extremely useful tool that was developed out of need (no other software can do that).

You can now find on the top menu 18 different example datasets of various different structures. This includes 4 examples of analytical techniques other than SIMS. This list of examples is as follows:
Dear user
A new version of simsMVA is out and it includes a number of new features. This will be a rather long list but we would like to highlight all major updates:
You can now find on the top menu 18 different example datasets of various different structures. This includes 4 examples of analytical techniques other than SIMS. This list of examples is as follows:
Datasets can now be saved into .mat files and subsequently loaded in any other new tab of the same kind (Spectra, Profiles, Images or 3D). No more stitching the same set of patches every time or waiting to load a long 3D dataset!

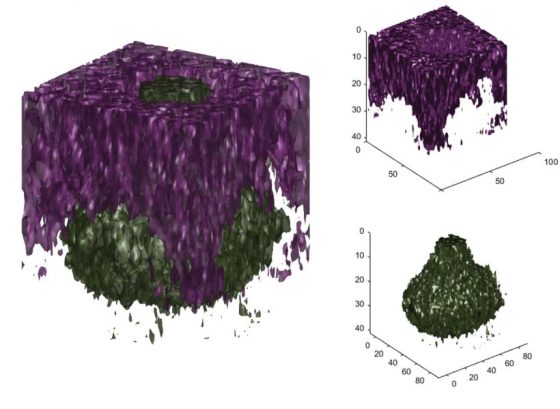
Additionally to a series of bug fixes in the 3D data loader, the 3D visualiser and the 3D overlay tools were redesigned to allow more customisation (they are also now applicable to both the original data AND MVA results!).
The Z-correction tool has also been improved. The user can now pre-process the data and select whether to base the correction on a substrate or topographical feature


It is now possible to convert a 3D dataset into 2D (imaging) or 1D (depth profiling) data. The converted dataset will be loaded on a new tab, maintaining its “hyperspectral” aspect. This is an extremely useful tool that was developed out of need (no other software can do that).
It had been long overdue, but it is finally possible to add peak labels in modes of analysis other than “Spectra”. A button has been added next to the variable selector in each mode.

And it is possible to change markers’ size!

Thank you very much for your support and feedback.
